02 Jul 2021
How to Audit Your Site for Google’s Core Vitals Algorithm Update
Google announced in late 2020 that Core Web Vitals are to become ranking signals for search engines starting May 2021. The Core Web Vitals update, also known as the Page Experience update, focuses on the UX of the web page. It will incorporate page experience as a ranking signal by measuring Core Web Vitals and giving preference to pages that Google determines to contain useful, relevant, and easily accessible content in response to a given search query.
Improving the user experience on your website is a crucial task in SEO and the search ranking of a site greatly depends upon its UX. And with Google’s Web Vitals update, it is going to become all the more important.
Google’s mission is to “organise the world’s information and make it universally accessible and useful.” These ranking factor changes are in keeping with that mission, extending the concept of accessibility and utility with an emphasis on user experience.
So, below, we will take you through how to audit your site in preparation for Google’s Core Vitals Algorithm Update.
Rollout Timeline of Google Page Experience Updates
Firstly, let’s begin with Google’s latest timeline for these updates. It was announced that the rollout will start Mid-June 2021, and will be completed by the end of August 2021.
June Updates:
- The ranking change
- AMP Badge will go away & will no longer be required for Google News
- Top Stories carousel feature on Google Search will begin to include all news content that meets both the Google News content policies and guidelines.
August Updates:
- Core Web Vital Metrics: LCP, FID, and CLS
- Mobile Friendliness, Safe Browsing, HTTPS, and No Intrusive Interstitials
Opportunities for Site Performance within the Latest Google Update
So there are three key opportunities for improved site performance within the latest update;
- Loading: Users should be able to experience quick load times. Slow-loading or never-ending pages are no fun for the user, and Google knows this. In fact, Google says that bounce rates increase by 106% if a page load time increases from 1–6 seconds. The Largest Contentful Paint (LCP) metric addresses this. Ideally, you want your load time under 2.5 seconds per page.
- Interactivity: Any delay on a user’s first input (like a click) is no good. The First Input Delay (FID) metric addresses this. Ideally, you want your interactivity metric under 100 ms.
- Visual Stability: Consider your own experience of a screen shifting right as you go to click something, and you end up clicking on the wrong button. The Cumulative Layout Shift (CLS) metric addresses this. Good visual stability should receive a score of less than 0.1.
By streamlining your page loads and solidifying your pages’ interactivity and visual stability, you’re setting your site up for SEO success.
Tools to Evaluate Your Page Experience
Collecting data on your site’s Web Vitals is the first step towards improving them. A well-rounded analysis will collect performance data from both real-world and lab environments. Measuring Web Vitals requires minimal code changes and can be accomplished using free tooling.
There are numerous tools across the web to help you evaluate your readiness for the Google page experience update.
It’s worth noting that many of these tools are multi-channel, so they can be just as beneficial for your social, content and PPC audits, as well as your website and SEO audits!
Audit your Core Vitals with Google’s Free Tools
Google itself suggests using the below tools to prepare for the Core Web Vitals;
- Search Console
- PageSpeed Insights
- Chrome UX Report
- Lighthouse
- Chrome DevTools
- Web Vitals Chrome Extension
- CrUX Dashboard
- Web.dev Measure
Google Search Console: Core Web Vitals Report
To fix poor user experience on your site, first, start with Google Search Console.
The report shows URL performance grouped by status, metric type, and URL group (groups of similar web pages).
Only indexed URLs can appear in this report. The URLs shown are the actual URLs for which data was recorded (that is, data is not assigned only to a page’s canonical URL, as it is in most other reports).
The report is based on three metrics: LCP, FID, and CLS. If a URL doesn’t have a minimum amount of reporting data for any of these metrics, it is removed from the report. Once a URL has a threshold amount of data for any metric, the page status is the status of its most poorly performing metric.
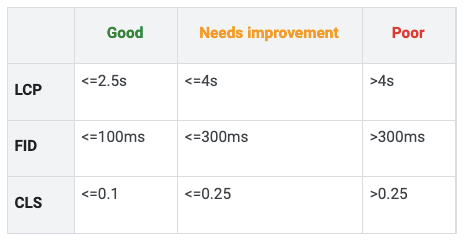
Status: Poor, Need improvement, Good
The labels: Poor, Needs improvement, and Good are applied to a URL on a specific device type.
A URL’s status is the slowest status assigned to it for that device type. So;
- A URL on mobile with Poor FID but Needs improvement LCP is labelled Poor on mobile.
- A URL on mobile with Needs improvement LCP but Good FID is labelled Needs improvement on mobile.
- A URL on mobile with Good FID and CLS but no LCP data is considered Good on mobile.
- A URL with Good FID, LCP, and CLS on mobile and Needs improvement FID, LCP, and CLS on desktop is Good on mobile and Needs improvement on desktop.
If a URL has less than a threshold of data for a given metric, that metric is omitted from the report for that URL. A URL with data in only one metric is assigned the status of that metric. A URL without threshold data for either metric will not be on the report.
Status Definitions
Status metrics are evaluated against the following boundaries:
Web.dev / Lighthouse Report
Next, we recommend using Web.dev to audit your site. It’s easy to use and most importantly, Google is using this report to measure site health.
Web.dev uses Lighthouse, an open-source, automated tool for improving the quality of web pages. You can run it against any web page, public or requiring authentication. It has audits for performance, accessibility, progressive web apps, SEO and more.
As lighthouse provides a competitive advantage to your online business by increasing your website’s overall performance and SEO.
You can run Lighthouse in Chrome DevTools, from the command line, or as a Node module. You give Lighthouse a URL to audit, it runs a series of audits against the page, and then it generates a report on how well the page did. From there, use the failing audits as indicators on how to improve the page. Each audit has a reference document explaining why the audit is important and how to fix it.
Google Lighthouse gives a breakdown of your site into the accompanying metrics:
- Performance
- Accessibility
- Best Practices
- SEO
- Progressive Web Applications
When the tool finishes analysing a web page, it returns a report with the calculated scores for each metric, a list of problems with the page, and general, or sometimes specific, recommendations regarding solving those problems.
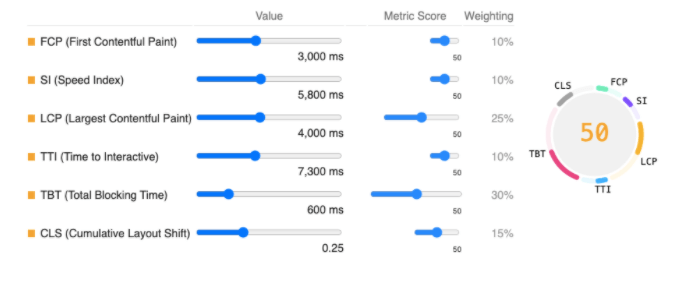
Lighthouse Scoring Calculator
How your Site Performance Score is Weighted
The Performance score is a weighted average of the metric scores. Naturally, more heavily weighted metrics have a bigger effect on your overall Performance score. The metric scores are not visible in the report but are calculated under the hood.
How Metric Scores are Determined
Once Lighthouse has finished gathering the performance metrics (mostly reported in milliseconds), it converts each raw metric value into a metric score from 0 to 100 by looking where the metric value falls on its Lighthouse scoring distribution. The scoring distribution is a log-normal distribution derived from the performance metrics of real website performance data on HTTP Archive.
For example, Largest Contentful Paint (LCP) measures when a user perceives that the largest content of a page is visible. The metric value for LCP represents the time duration between the user initiating the page load and the page rendering its primary content. Based on real website data, top-performing sites render LCP in about 1,220ms, so that metric value is mapped to a score of 99.
How your Site is Scored on Lighthouse
These four metrics are the first thing you see once the audit is complete;
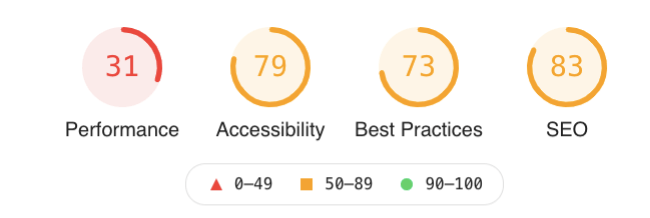
Performance
Broken down into;
Metrics:
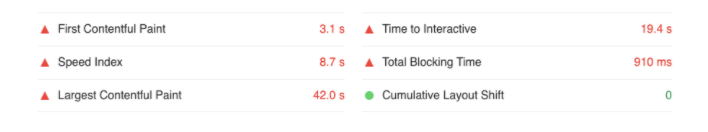
First Contentful Paint – Scoring
- FCP time under 2 seconds—green, fast
- FCP time from 2 to 4 seconds—orange, moderate
- FCP time over 4 seconds—red, slow
Speed Index – Scoring
- Speed Index under 4.3 seconds—green, fast
- Speed Index from 4.4 to 5.8 seconds—orange, moderate
- Speed Index over 5.8 seconds—red, slow
Large Contentful Paint – Scoring
- LCP under 2.5 seconds—green, fast
- Speed Index from 2.5 to 4 seconds—orange, moderate
- Speed Index over 4 seconds—red, slow
Time To Interactive – Scoring
- TTI under 3.9 seconds—green, fast.
- TTI from 3.9 to 7.3 seconds—orange, moderate
- TTI over 7.3 seconds—red, slow
Total Blocking Time – Scoring
- TBT under 300 milliseconds—green, fast.
- TBT from 300 to 600 milliseconds—orange, moderate
- TBT over 600 milliseconds—red, slow
Cumulative Layout Shift
This metric takes into account only unexpected layout shifts. An unexpected layout shift is a layout shift that has had no user input within a 500ms time frame prior to the shift.
Opportunities: These suggestions can help your page load faster. They don’t directly affect the Performance score.
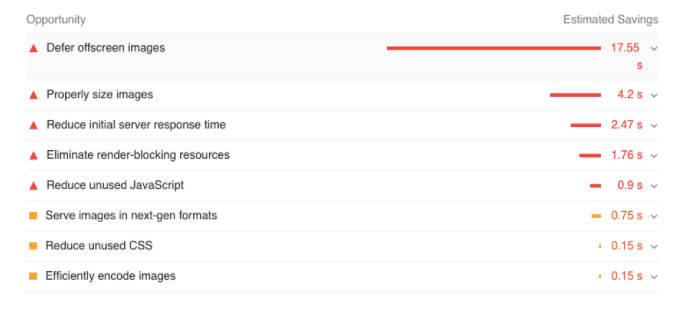
Diagnostics: More information about the performance of your application. These numbers don’t directly affect the Performance score.
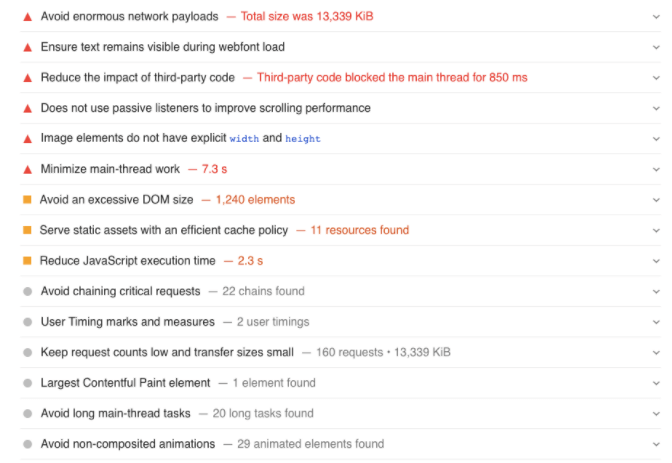
In general, only metrics contribute to your Lighthouse Performance score, not the results of Opportunities or Diagnostics. That said, improving the opportunities and diagnostics likely improve the metric values, so there is an indirect relationship.
Accessibility
These checks highlight opportunities to improve the accessibility of your web app. Only a subset of accessibility issues can be automatically detected so manual testing is also encouraged.
Broken down into;
Names and labels: These are opportunities to improve the semantics of the controls in your application. This may enhance the experience for users of assistive technology, like a screen reader.

Contrast: These are opportunities to improve the legibility of your content.
Internationalisation and localisation: These are opportunities to improve the interpretation of your content by users in different locales.
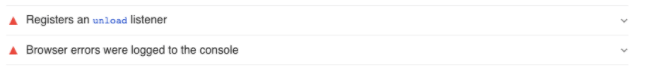
Best Practice
Broken down into;
Trust and Safety
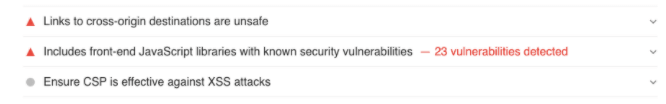
General
SEO
These checks ensure that your page is optimized for search engine results ranking. There are additional factors Lighthouse does not check that may affect your search ranking.
Broken down into;
Content Best Practices: Format your HTML in a way that enables crawlers to better understand your app’s content
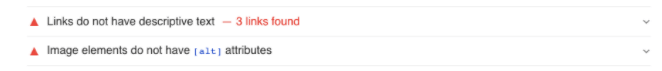
Mobile-Friendly: Make sure your pages are mobile-friendly so users don’t have to pinch or zoom in order to read the content pages.
JavaScript Treemap and Code Coverage
Lighthouse now includes a treemap view showing JavaScript page size across different bundles. You can access it through the ‘View Treemap’ button near the top of the Performance section.
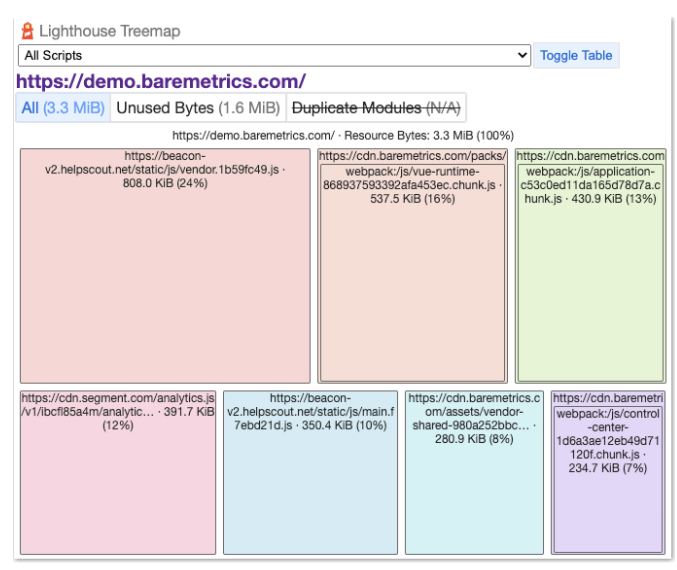
If your app provides public source maps Lighthouse will break down bundle size by the source file. Chrome also collects code coverage data, showing which parts of the code are run and which parts are unused. Click Unused bytes to highlight the percentage of unused code in red.
Other Tools to Audit Core Web Vitals
There are other non-Google tools that we’d recommend to audit your site, including;
Our top three powerful non-Google digital marketing audit tools are GTmetrix, Screaming Frog and SEMRush. Let’s dive a little deeper…
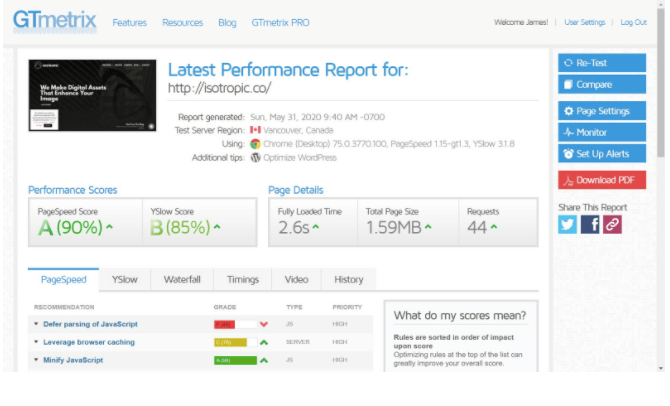
GTmetrix
The key objective of GTmetrix is to analyse the performance of your website and provide you with a list of actionable recommendations to improve it. It provides you with marketing, search engine optimisation, and search engine marketing solutions.
This tool doesn’t just measure the speed of your page, it offers many advanced features like waterfall loading charts and video playback. You can use these advanced features to access more data and information than some other website speed performance tools on the web.
How to Use GTmetrix
Once you have loaded the tool, you can enter the page URL that you want to test, and then click analyse. you can enter the domain of your homepage, or the domain of an individual page that you want to test period for example, if you have blog posts that have a template applied to them, you can enter a single blog post to see how fast it loads.
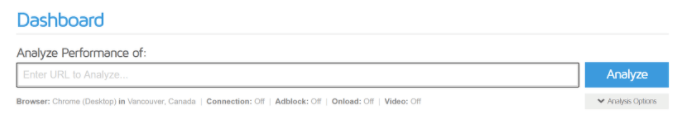
There are a couple of options that you can manipulate before even running the analysis of your page with GTmetrix.
Running the Scan
When you click analyse, GTmetrix will put your URL in a queue to be tested. It will then run it through its several different testing engines, and when complete, output put a report for you. It may take several seconds as only so many people can be using this tool at once, and they run your website through several different tests.
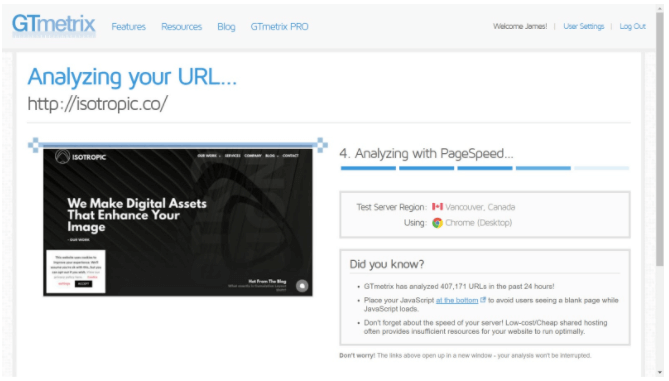
On the loading screen, there are always a bunch of interesting statistics, like the number of websites that GTmetrix has analysed in the past 24 hours. This usually hovers around 400,000 to 500,000.
Once your page loads, you get access to your test and all the data behind it.
Benefits of GTmetrix
- Analyse your site’s speed and make it faster
- GTmetrix gives you insight into how well your site loads and provides actionable recommendations on how to optimise it
- GTmetrix tells you a lot about your website performance
- It also gives you the full picture of how your site loads and helps you detect where bottlenecks are
- Schedule GTmetrix to test your pages daily, weekly or monthly to ensure your site stays optimised
- Analyse the loading of your site from different regions around the world to see how users in the area would see it
- Get alerts if your page triggers a certain condition
- Simulate your page load on various devices (phones/tablets) or screen resolutions, create presets for frequently used options
Services and Features
- PageSpeed and YSlow scores and Recommendations
- Page Load Details (time, size, number of requests)
- Various Analysis Options
- Waterfall, Video and Report History
- Monitor Pages
- Set up Monitored Alerts
- Test from Multiple Regions
- Analyse with Mobile
- Video Capture
- Developer Toolkit
Screaming Frog
Screaming Frog works like Google’s crawlers, but this SEO spider tool takes crawling up by a notch by giving you relevant on-site data and creating digestible statistics and reports. With simpler site data from Screaming Frog, you can easily see which areas your website needs to work on.
The Screaming Frog software can help you perform the following tasks for your SEO efforts:
- Broken link searches
- Temporary and permanent redirect searches
- Metadata analysis
- Duplicate content searches
- Review robots.txt and other directives
- XML sitemap creation
- Site architecture analysis
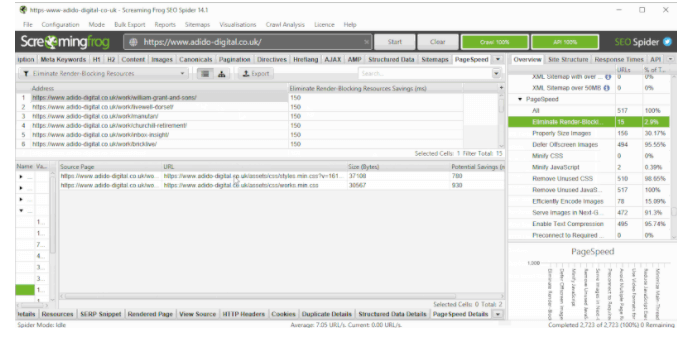
By connecting a PageSpeed Insights API with the Screaming Frog spider, you can create a very powerful tool to quickly measure Core Web Vitals for your entire website.
How to Audit with Screaming Frog
To start the audit, you will need three things:
- A paid version of the Screaming Frog website crawler.
- A PageSpeed Insights API key (which you can get from this Google PageSpeed Insights documentation page).
- The domain of the website you are auditing.
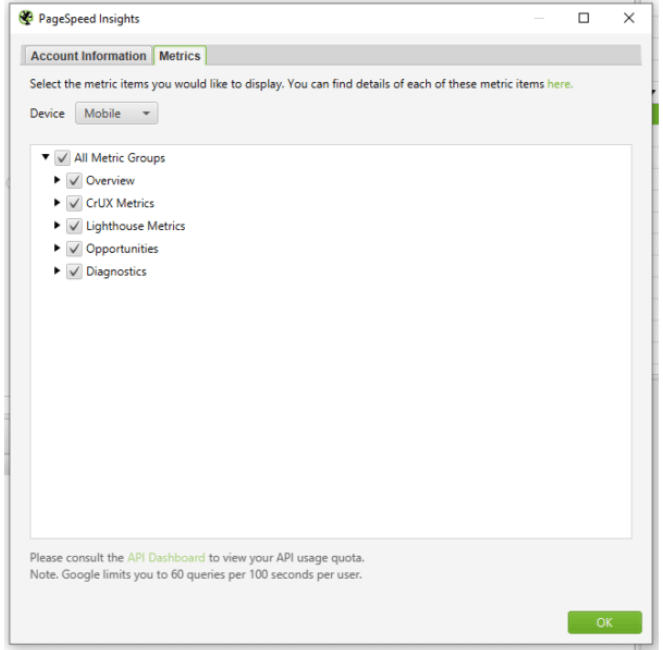
Step 1: Connect the PageSpeed Insights API key to Screaming Frog
Once connected, click on “Metrics.” Here you will define the metrics that will be displayed within your crawl. For the purposes of this audit, I am selecting “All Metric Groups,” but you can choose just the ones you want to report on and click “OK.”
The metrics groups available are as follows:
- Overview – Provides general overview information for the page, such as the size of the page and the potential load savings that could be made on the page.
- CrUX Metrics – Data from the Chrome User Experience Report. If field data is available from real-life, opted-in users, it will appear here.
- Lighthouse Metrics – Most of the lab data we use within the audit comes from here, including LCP, TBT and CLS scores.
- Opportunities – Provides suggestions for page speed improvements specific to each page.
- Diagnostics – Provides additional information about the overall performance of the website being crawled.
Step 2: Crawl the website

Step 3: Report the size of the problem
Step 4: Report examples of the issues specific to each page
Step 5: Once changes have been made, crawl the site again and compare
Additional Features of Screaming Frog
- Crawling support for staging sites – Along with live websites, Screaming Frog will allow you to crawl staging sites. But you’ll need to enter your login credentials before you can start.
- Compare and run multiple crawls – You can run Screaming Frog in multiple windows and crawl multiple websites (and compare these crawls at the same time).
- Crawling support for web forms – Screaming Frog isn’t just for crawling websites — it can also crawl web forms. Access this feature by heading over to Configuration > Authentication > Forms Based to start a form crawl.
- All Anchor Text option – This feature under the Bulk Export menu includes all of your website’s anchor text in a CSV file. It also shows you the text’s locations and links.
- Crawl Analysis – The Crawl Analysis feature helps calculate link scores. Other filters may also require calculation after you crawl your website.
SEMRush
SEMrush Site Audit is a tool that can crawl any website to detect technical SEO issues and provide data for analysis. With this site audit tool, you can perform a comprehensive technical SEO audit at high speed.
How to Audit with SEMRush?
Set your user-agent to mobile if you want to evaluate your site’s mobile version, or desktop if you want to evaluate the desktop version.
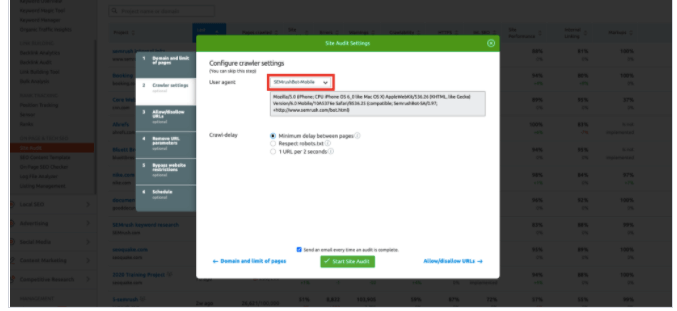
Once you’ve finished configuring your Site Audit, run the audit and you should see results in a few minutes.
After running an audit, locate the report on your core web vitals nearby the Thematic Reports.
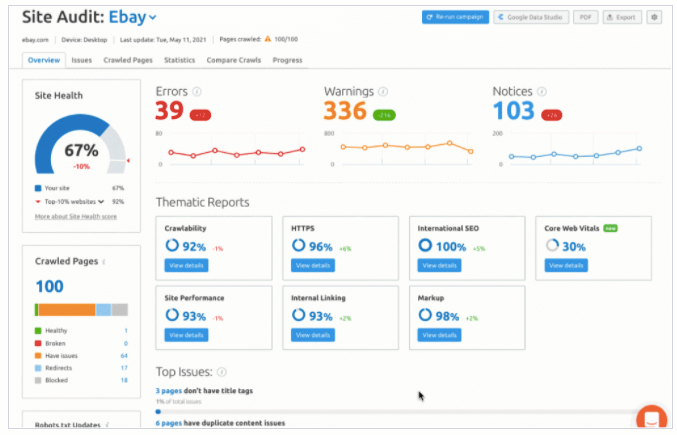
With this, you can quickly see a report and learn if your pages have poor, in need of improvement, or good core web vitals without adding another step to your auditing workflow.
According to Google, the pages on your site should all be “good” in regards to each of these 3 metrics.
This report can currently check up to 10 URLs on your site. You can change these 10 pages at any time from above the table in the report. Just select “Edit list” and then you’ll be able to check exactly the pages you want to.
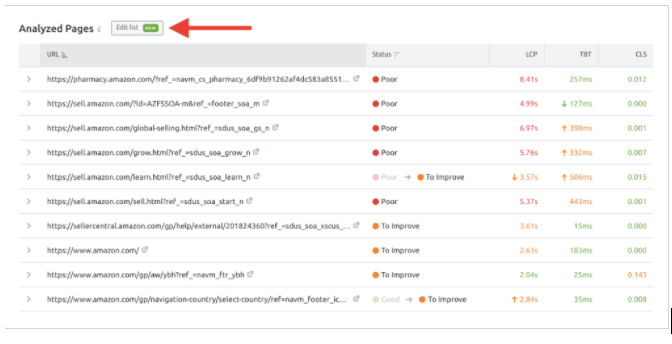
Take a screenshot to save this information. This is what you should share with your development team along with the recommendations that will help optimise your Core Web Vitals.
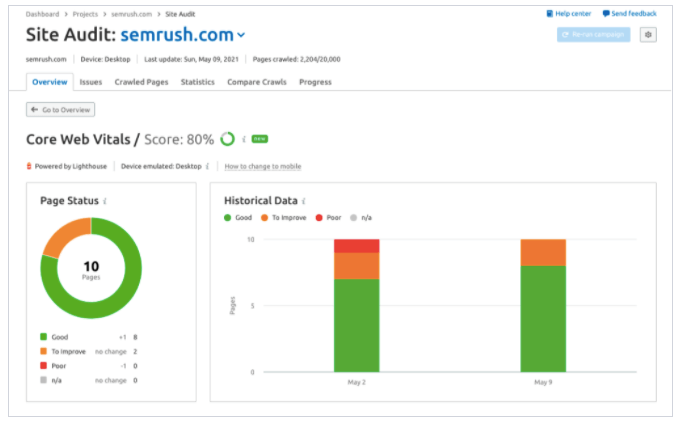
The benefit of this report is that you can re-run the audit after making adjustments and see the trend of your CWVs as they improve or worsen after any changes to the site.
In your first audit, the 10 URLs will be the first 10 that are checked by our crawler. If you set your crawl scope up as a file of URLs, we will check core web vitals for the first 10 rows of your file. After the first crawl, you can customize the 10 pages to check at any time.
The data in this report is collected via Google Lighthouse.
Benefits of Using Semrush Site Audit Tool
- Check your site’s health
- You can prioritize SEO issues and fix them
- Track your SEO progress
- Fix hreflang mistakes
- Detect security issues
Other Site Audit Checks that Can Help
As far as keeping up with the rest of your site, you should also keep an eye open for these other checks in Site Audit that can help you monitor your performance;
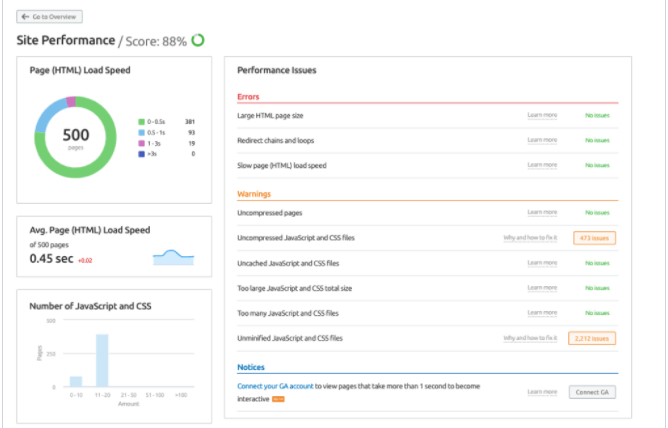
- Slow loading pages
- Pages with too large HTML size
- Issues with broken internal JavaScript and CSS files
- Unminified CSS/JavaScript
- Issues with uncached JavaScript and CSS files
- Uncompressed JavaScript and CSS files
- Uncompressed pages
- Pages with JavaScript and CSS total size that is too large
- Pages with too many JavaScript and CSS files
There’s even a Site Performance report to quickly find your site’s performance-related issues.
Core Web Vitals in JavaScript
You can simply push Core Web Vitals data to Google Analytics with the help of JavaScript. It can be done with the help of the following code:
import {get CLS, getFID, getLCP} from ‘web-vitals’ ;
function sendToAnalytics (metric) {
const body = JSOM.stringify (metric) ;
// Use ‘navigator.sendBeacon()’ if available, falling back to ‘fetch()’.
(navigator.sendBeacon & navigator.sendBeacon( ‘ /analytics’, body)) ||
fetch ( ‘ /analytics’, {body, method: ‘POST’, keepalive: true}};}
getCLS (sendToAnalytics) ;
getFID (sendToAnalytics) ;
getLCP (sendToAnalytics) ;
Be Google Algorithm Update-Ready
There are a lot of ways you can optimise your Google page experience. Don’t know where to start? Follow these steps…
- Understand the Performance Data That Google Provides
- Compare Your Page Experience Data To Competitors
- Identify Your Users’ Top Pain Points
- Prioritise the Top Pain Points
- Work with Developers to Determine Feasibility
- Work with Devs to Determine Realistic Timelines
Fixing Core Web Vitals Crawl Errors and Issues
After you have audited Core Web Vitals on your website, the next port of call is to fix the issues.
Image Optimisation
Image optimisation is an important SEO website UX factor. Ensure your image appears within the LCP threshold.
Content Optimisation
Content has an overriding importance in digital marketing. For Google also, quality content is essential. So, make sure to maintain high-quality content on your website.
Mobile Responsiveness
Google prioritises the experience of its mobile users. Hence, mobile responsiveness plays a very crucial role in search engine optimisation and subsequently for the Core Web Vitals.
Upgrading Web-Hosting
If you see issues in the Page Speed, it will most likely be due to poor web hosting. Hence, it is best to upgrade your web hosting for faster server response and minimum delays.
We hope this guide gives you the headstart you need to better understand how to audit your site for Core Web Vitals and be fully prepared for Google’s Page Experience Update. Be sure to check out our Essential Guide to Image Optimisation, for a faster and healthier site that Google approves of, and don’t forget to listen to our Core Web Vitals playlist for some inspiration!
Our success formula has been distilled from years of experience, covering all elements with a strong focus on user experience, technical SEO and site performance.
Our team is fully equipped to fertilise your digital home and deliver results that matter to you; drop us a line.
Drop us a line.
Consultancy
Strategy & Insights
Digital Marketing
Visual Communications
Campaigns
UX, CX & CRO
Development
Company
Visit us.

Seventh Element
145 City Road
London
EC1V 1AW