The 2019 charity digital playbook was reasonable for 2019. Optimise for a small set of head terms (“donate to children’s charity”, “best UK animal welfare charity”). Aim for first-page Google rankings. Send the traffic to a five-step donation form. Tweak the suggested amounts twice a year. Wait for the year-end push. It worked, more or less, because that was how donors found and gave at the time.
The donor that playbook was designed for is being joined, slowly but unmistakably, by a new cohort with different habits. Some now research the cause in ChatGPT or Perplexity before they ever reach a search engine. A growing share land on charity sites already pre-qualified by a Google AI Overview. Most donors are now on mobile (52% of nonprofit traffic, M+R Benchmarks 2025), and an increasing proportion will abandon in seconds if the page is slow or Apple Pay is not visible. They expect transparency before the donation page asks for the gift, not after. 56% of 25-34s prefer online giving; even 30% of 65-plus now do too. The dominant donor behaviour is not 2019 any more. It is also not yet a single 2026 archetype. It is a transition, and most charity funnels are built for one end of it.
The bigger fundraising story for UK charities in 2026 is still cost-of-living. Public donations dropped from £15.4bn in 2024 to £14bn in 2025, a 10% fall. There are roughly six million fewer UK donors than there were a decade ago. 2.8 million people cancelled regular gifts in 2025 alone. Affordability dominates non-donor reasoning. This article is not about pretending AI search is the bigger crisis. The bigger crisis is the household budget. The argument is narrower and more uncomfortable: the donors who can still give are the donors every charity will compete for, and most charities are competing with a digital strategy designed for the search engine they used to use.
| The 2019 Charity Playbook | Where Donor Behaviour Is Heading | What Closes the Gap |
|---|
| Rank on page 1 of Google for “donate to [cause]” | Be cited inside the AI Overview or ChatGPT answer | GEO + structured data + specific content |
| Backlinks from sector publications | Brand search volume + multi-platform mentions | PR as a search function, not a side activity |
| 800-word “About our work” pages | Specific, statistic-rich answer content built for retrieval | Specificity, named beneficiaries, named numbers |
| Schema markup: none, or basic Organization | NGO + DonateAction + FAQPage + Organization graph | One technical sprint, lasting impact |
| 5-step donation form, card-only | Single step, Apple Pay and Google Pay above the fold | Donation flow rebuild |
| Trust signal: About Us page and trustee list | Real-time impact data, transparency hub, schema-marked impact | Schema + content discipline |
| Mobile = afterthought | Mobile = 52% of nonprofit traffic, 28% of revenue | Mobile-first donation funnel |
| Success metric: sessions and pageviews | AI citations, brand search lift, AI-referred conversion | New measurement model |
This is not a panic article. This is an audit article. The work to be visible in AI search is the same work that improves traditional search, donor trust and conversion. The compounding starts the quarter you begin. The compounding does not start until you do.
The Numbers That Should Worry the Sector
Three data points sit at the centre of this argument. None of them are about web design. All three are about search visibility and conversion.
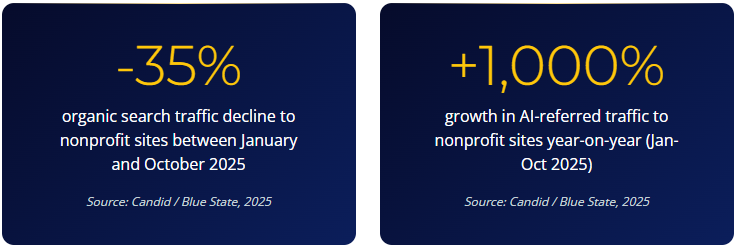
First number. Organic search traffic to nonprofits fell 35% in the first ten months of 2025 (Candid / Blue State, analysing 24 nonprofit websites). One conservation charity in the sample saw a 50% decline in the same window. This is not a long, slow erosion. It is a one-year cliff, caused by Google AI Overviews answering more queries inside the search results page, and by ChatGPT, Gemini and Perplexity intercepting the informational queries before donors ever reach Google.
Second number. AI-referred traffic grew 1,000% in the same window. AI-referred visitors stay 70% longer on nonprofit sites and give larger gifts on average than non-AI search visitors. They also convert at one-eighth the rate of standard visitors, which means the channel is high-intent but small in volume today. The trajectory matters more than the volume. AI search adoption is following the shape of every previous search behaviour shift: small for a while, then very quickly not small.
Third number. UK charitable giving fell 10% in 2025 to £14bn (CAF UK Giving Report 2026). Sector digital maturity sits at 5.1 out of 10, with only 44% of UK charities having a documented digital strategy at all, down from 50% the year before (Charity Digital Skills Report 2025). The sector is contracting financially while simultaneously dis-investing in the capabilities that would help it recover. The two trends are not separate. They are causal.
Discovery Is Starting to Move (Some Donors Now Ask ChatGPT)
The first stage of the donation journey is beginning to shift for a growing share of donors. Five years ago, a prospective donor researching “best UK charity supporting young people leaving care” would almost certainly type that phrase into Google, scan two or three results, click into a couple of charity websites, compare About pages, and then make a decision. The journey was linear, slow, and visible to traditional analytics.
In 2026, some of those donors will still do exactly that. A smaller but rising share are typing the same phrase into ChatGPT or Perplexity instead, or alongside Google. When they do, the answer arrives as a synthesised paragraph naming three or four charities, with brief reasoning for each. They might click one of the cited links. They might not. If they click, the data on their behaviour is clear: they arrive on a charity site already pre-qualified, with 70% longer engaged time and larger average gifts than non-AI search visitors (Candid / Blue State, 2025). They are also a much smaller cohort today. Blue State’s 2025 study of 1,728 donors found that 4.5% currently use AI to find or research causes. The figure was effectively zero five years ago.
4.5% is small. The trend is not. Compare it with the trajectory of mobile traffic in 2010, social media donations in 2014, contactless giving in 2018. Each was below 5% before it became the dominant behaviour in its category. The charities that planned for the shift while the absolute number was small were the ones positioned when the shift accelerated. The charities that waited for the proof point were behind by a year, and never fully caught up.
4.5% of donors using AI is not a behaviour to dismiss. It is a behaviour to design for. The same percentage of UK households were online in 1998. The same percentage of donations went through online platforms in 2002. Strategy is built for the trajectory, not the current state. Reaction is built for the current state and arrives late.
Why Your Charity Is Not Being Cited
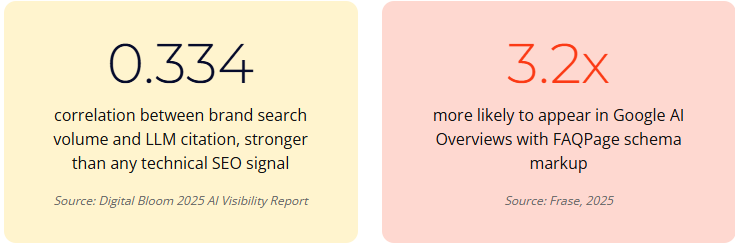
The Digital Bloom 2025 AI Visibility Report studied the signals that predict whether an organisation gets cited inside an AI answer. The strongest single predictor is brand search volume, with a correlation of 0.334. Branded anchor text correlates at 0.527. Backlinks, the traditional currency of SEO, showed weak or neutral correlation. Sites present on four or more major platforms are 2.8 times more likely to be cited by ChatGPT than single-platform organisations. Adding statistics to content boosts AI visibility by 22%. Adding direct quotations boosts it by 37%.
Translate that into charity reality. The signal AI engines use to decide whether your charity is real, credible, and worth citing is the same signal that makes a donor trust you: brand recognition, third-party validation, named outcomes, specific evidence. The work overlaps. Most UK charities are doing little of it on purpose, and what they do is rarely structured for machine retrieval.
The most common failure is vagueness. A homepage that says “we support vulnerable communities across the UK” does not get cited. A homepage that says “we provide emergency housing for 16-25 year-olds in West Yorkshire” does. AI engines are trained to retrieve specific, verifiable answers. Generic mission statements are not retrievable answers. They are filler around a logo. The Frase research on AEO found that replacing vague claims with specific statistics increases citation rates by approximately 32%.
The second common failure is structured data absence. Schema.org provides explicit types for non-profits — NGO, Organization with NonprofitType, DonateAction for donation pages — and AI engines lean heavily on this markup when deciding what your site is about. Most UK charity websites implement little or none of it. Adding it is approximately a one-day technical task. The compounding visibility benefit lasts for years.
The third failure is content placement. The Digital Bloom analysis found that 44.2% of all LLM citations come from the first 30% of a page’s text. The answer-first paragraph at the top of your About, impact, and donation pages is doing more visibility work than the rest of the page combined. Most charity pages bury the answer at the bottom, under three paragraphs of warm-up about the journey, the mission, and “our story so far”. The AI does not read journeys. It retrieves specific claims, near the top, expressed clearly.
The Donation Page That Has Not Been Updated Since 2019
This is the conversion side of the same problem. Even if a donor finds you, recognises you, and clicks through to your site already half-decided, the donation page itself is where the journey collapses in the sector. M+R Benchmarks 2025 sets the picture in plain numbers. Average nonprofit donation page conversion sits at 11% on desktop and 8% on mobile, a 27% performance gap. Small charities convert mobile users at just 4%. Mobile traffic accounts for 52% of nonprofit visits but only 28% of revenue, because the mobile donation experience is consistently worse than the desktop one.
The standard sector donation form is a five-step process designed for desktop in roughly 2018. Personal details, gift amount, optional message, payment information, confirmation. It works, in the sense that it does process gifts. It also abandons 50-70% of donors who reach it (Fundraise Up, iDonate 2025 benchmarks). Median completion rate is approximately 12%, which is to say roughly seven in eight donors who reach a donation page do not finish the transaction.
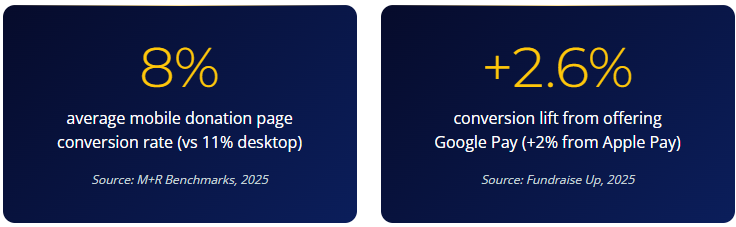
Two specific fixes have the largest measured impact on this conversion rate. Apple Pay availability lifts conversion by approximately 2%; Google Pay by approximately 2.6% (up to 4% among Chrome users). Yet only 47% of UK nonprofits currently offer Apple Pay, and only 40% offer Google Pay (M+R Benchmarks 2025). 75% of millennials and 71% of Gen Z use a digital wallet regularly. The charities not offering one-tap wallet payment are explicitly designing their donation page for donors who do not exist any more.
The second variable is page load speed. iDonate’s 2025 research found that increasing donation page load time from 1 to 3 seconds increases bounce rate by 32%. Each additional second of delay reduces conversion by up to 7%. A 4-second load time, which is common across the sector on mobile, can collapse conversion by 450% compared with a 1-second load. Page speed is sometimes treated as a technical detail. It is the single most measurable conversion variable in the funnel.
The Search-to-Donation Funnel (The Audit Framework)
This is the actionable output. The framework we use when auditing a UK charity’s full search-to-donation journey. Seven stages. Where the leaks happen. What to fix.
| Stage | Where Donors Leak | What to Fix |
|---|
| 1. Discovery (Google + a growing share via AI) | Charity not cited (or not ranked) because brand search is low and content is vague | Brand search building; specific, statistic-rich content; multi-platform presence |
| 2. Recognition (AI Overview / cited result / SERP) | Charity surfaces with wrong remit, outdated facts, or not at all | NGO + FAQPage schema; canonical “what we do” answer in the first 30% of every key page |
| 3. Site visit | AI-referred donors land pre-qualified; homepage waffles; no clear path to donate | Cut homepage to one CTA; impact-led, answer-first hero block |
| 4. About / impact research | Donor wants proof the money lands; charity provides journey narrative | Real-time impact data; transparency hub; named numbers, schema-marked |
| 5. Donation page | 52% on mobile, 8% mobile conversion, no Apple Pay (53% of sector) | One-tap wallet; single step; sub-2 second load; mobile-first design of flow |
| 6. Form completion | 50-70% abandonment; too many fields; suggested amounts arbitrary | 3 fields max before payment; impact-tied suggested amounts |
| 7. Stewardship (post-gift) | One-off thank-you; no monthly upgrade prompt | Immediate upgrade path to regular giving in the confirmation flow |
The framework is deliberately staged. You do not need to fix everything at once. You need to know where the leaks are, which leaks are the most expensive, and which leaks compound. The Discovery and Recognition stages are GEO work. The Site visit and About stages are content and structured data work. The Donation page, Form, and Stewardship stages are conversion work. They all belong to the same funnel. Most UK charities have ownership of these stages split across three different teams, none of whom share data.
For more on the GEO and AI search side of the framework, see our work on generative engine optimisation services. For the foundational SEO layer underneath, our SEO services for charities. And for the broader content discipline that powers both, our AI-powered content systems.
The 2019-to-2026 Gap, In Plain Numbers
If the rest of the article has been the argument, this is the receipt. Set the numbers next to each other and the gap is hard to defend.
- UK charitable giving: £15.4bn in 2024, £14bn in 2025. Down 10% in twelve months (CAF UK Giving 2026).
- UK donor base: Down six million people since 2016. 31m UK adults gave in 2025, against 37m in 2016.
- Average gift: £72 in 2024. £65 in 2025. Down £7 per gift in twelve months.
- Online share of donations: Now 60% of all UK donations flow through digital channels.
- Generational preference: 56% of 25-34s prefer online giving. 30% of 65+ now do too.
- Sector digital maturity: Average 5.1 out of 10. Only 44% have a digital strategy (down from 50% YoY).
- Sector solvency: 22.5% of UK charities in operating deficit (2023). 42% spent more than they earned.
- Government grants: Down approximately £1bn a year in real terms since 2020.
- Public trust: 57% high trust in charities. 53% cite “most donations reach the cause” as the top driver. 39% cite transparency.
- Search shift: Organic nonprofit traffic -35% in 2025. AI-referred traffic +1,000% in 2025.
The combination is uncomfortable. A sector with fewer donors, smaller gifts, tighter balance sheets and falling digital maturity is also being structurally rerouted by search behaviour change. The charities that adapt now do so with less competition. The charities that wait until the data forces the conversation will be having that conversation while their organic traffic is already half what it was in 2024.
The Honest Counterpoints
Three things this article should not be allowed to dodge.
First, cost-of-living is the bigger driver, not search visibility. 49% of non-donors cite affordability as the reason, up from 44% in 2024. A perfectly optimised GEO strategy cannot conjure £65 out of a household budget already underwater. The honest framing: search visibility decides which charity the donor who can still give chooses to remember. It does not decide whether they have the money to give in the first place. The two crises run in parallel.
Second, small charities have limited capacity for SEO and GEO projects. 67% of UK charities cite squeezed finances as the top digital barrier; 63% cannot fund infrastructure improvements (Charity Digital Skills Report 2025). The honest framing: the highest-leverage GEO change costs no money. Rewriting your About page with specific beneficiaries, named locations, and named numbers is editorial time, not agency budget. Adding Schema.org markup is a one-day technical task. Adding FAQPage schema to the questions donors actually ask is an afternoon. The transformation does not require a transformation programme. It requires editorial attention applied to the right pages.
Third, AI search adoption is still small in absolute terms. 4.5% of donors today is genuinely small. The honest framing: the same logic applied to mobile in 2010 and social donations in 2014. The behavioural cliff is in front of the data, not behind it. Strategy is built for 2027, not 2024. The cost of building the AI-ready funnel today is low. The cost of building it in 2027, while competitors are already cited, will be substantially higher.
The compound case for action now is not panic. It is timing. The work to be visible in AI search is the same work that improves traditional search, donor trust and donation conversion. The compounding starts when you start. The charity that begins this quarter is twelve months ahead of the charity that begins next April. Twelve months of compounding visibility is not a small advantage. It is the difference between being cited and being remembered.
What to Fix First (the Prioritised Order)
If the framework above is the audit, this is the sequence. The charities we have walked through this work usually try to do everything at once. The work compounds faster when sequenced.
- Specificity sweep. One week. Rewrite your About, impact, donate and key cause pages to replace vague claims with named beneficiaries, named geographies, and named numbers. No agency required. This single change does more for AI citation than any other action on the list.
- Schema.org NGO and DonateAction markup. One technical day. Adds the machine-readable identity that AI engines look for first.
- FAQPage schema on transparency content. Half a day. Cover the questions donors actually ask AI: admin overhead, how donations are spent, trustee accountability, impact measurement.
- Donation page rebuild for mobile and one-tap payment. Sprint of two to three weeks. Single step. Apple Pay and Google Pay. Suggested amounts tied to impact figures. Three form fields maximum.
- Page speed audit and fix. Aim for sub-two-second load on the donation page. Every second above two costs measurable donations.
- Transparency hub. One page aggregating Charity Commission number, audited accounts, impact reports, named trustees. This is the trust signal donors and AI both look for first.
- Brand search lift programme. Coordinated PR, sector publication coverage, owned-media presence. Brand search volume is the strongest single predictor of LLM citation. Earn it deliberately.
The charities we have walked through this work in the last twelve months are not bigger or better resourced than the average. They are the ones who decided to sequence the work and start it. The compounding does the rest. Browse the Fuel Room for the wider context on AI search, donor behaviour and the structural shift the sector is moving through.
Your Search-to-Donation Audit: 10-Point Diagnostic
- Test what AI says about your charity. Ask ChatGPT, Gemini, Perplexity and Claude: “What does [your charity] do?” and “What charities support [your cause area]?” Document every error, omission and hallucination. This is your baseline.
- Audit specificity on key pages. About, impact, donate. Replace “supporting vulnerable communities” with named beneficiaries, named geographies, named numbers. Editorial time, not budget.
- Implement Schema.org NGO and DonateAction markup. One technical day. Most charities have no structured data; the early adopters get disproportionate visibility.
- Add FAQPage schema to transparency content. Cover admin overhead, where donations are spent, trustee accountability, impact measurement. 3.2x more likely to appear in AI Overviews.
- Audit your donation page for the four conversion variables. Mobile-first design of the flow, sub-2 second load, Apple Pay and Google Pay availability, three form fields maximum before payment.
- Tie suggested gift amounts to specific impact. “£25 = a week of after-school support for one child” outperforms £10 / £25 / £50 unlabelled. Specific outcomes also feed AI citation.
- Build a transparency hub. Single page: Charity Commission number with register link, audited accounts (last three years), impact reports, named trustees, governance documents.
- Move success metrics from sessions to citations. Track AI citation by query, brand search volume over time, AI-referred conversion rate. These are the new KPIs.
- Plan a brand search lift programme. Coordinated PR, sector publication coverage, owned-media expansion. Brand search volume is the strongest predictor of LLM citation. Earn it on purpose.
- Repeat the test in 90 days. Re-run the AI prompts from step one. Document the changes. The signal you are looking for is fewer hallucinations, more correct details, and citations on queries your charity did not previously appear in.
Frequently Asked Questions
Make your donation pages discoverable. Not just findable.
Free Search-to-Donation audit. We will tell you where your charity is leaking donors between ChatGPT and the thank-you page.
Sources
- CAF UK Giving Report 2026 (via Civil Society) – UK giving fell 10% in 2025 (£15.4bn → £14bn); 6m fewer UK donors than 2016; average gift down £7 to £65; 2.8m cancelled regular gifts; 49% of non-donors cite affordability
- Candid / Blue State (2025) – AI traffic to nonprofit websites grew 1,000% YoY at 2% of total traffic; organic traffic to nonprofits fell 35% Jan-Oct 2025; AI visitors stay 70% longer and give larger gifts but convert at 1/8 the rate; Blue State found 4.5% of donors currently use AI to research causes (1,728 donors surveyed)
- Charity Commission Public Trust in Charities (2025) – 57% of UK adults have high trust in charities; 53% cite “most donations reach the cause” as top trust driver; 39% cite transparency; 64% believe charities they know maximise spend on the cause (up 7% YoY)
- Charity Digital Skills Report 2025 – Sector digital maturity 5.1/10; only 44% have a digital strategy (down from 50% YoY); 67% cite squeezed finances as top digital barrier
- Charity Commission Sector Risk Assessment 2025 – 22.5% of UK charities reported operating deficit in 2023; 42% spent more than they earned
- NCVO Road Ahead 2025 – Government grants to UK charities down ~£1bn/year in real terms since 2020
- Enthuse Donor Pulse 2025 (via Empower Agency) – 60% of UK donations now flow through online channels; 44% donated online in past 3 months; 56% of 25-34s prefer online donations; 30% of 65+ prefer online
- M+R Benchmarks 2025 – Average donation page conversion 11% desktop / 8% mobile; mobile = 52% of traffic but only 28% of revenue; small nonprofits convert mobile at 4%; monthly giving 31% of online revenue; 47% offer Apple Pay, 40% Google Pay
- Fundraise Up (2025) – Apple Pay lifts donation conversion by 2%; Google Pay by 2.6% (up to 4% among Chrome users); 75% of millennials and 71% of Gen Z use digital wallets regularly
- iDonate (2025) – 1→3 second load increases bounce 32%; every second of delay = up to 7% conversion drop; 4-second load can collapse conversion by 450% vs 1-second
- Digital Bloom 2025 AI Visibility Report – Brand search volume strongest predictor of LLM citation (0.334 correlation); branded anchor text 0.527; sites on 4+ platforms 2.8x more likely cited by ChatGPT; statistics +22% AI visibility; quotations +37%; 44.2% of citations from first 30% of page
- Frase (2025) – FAQPage schema pages 3.2x more likely in Google AI Overviews
- Frase GEO Playbook (2025) – Replacing vague claims with specific statistics increases citation rates by ~32%
- Search Atlas (December 2024) – Counterpoint: no consistent correlation between generic schema coverage and LLM citation; the signal is FAQ-specific and content-quality dependent
- iDonate / M+R Benchmarks (2025) – 50-70% donation form abandonment is sector norm; median completion rate ~12%