Picture the monthly marketing review. Twenty-three slides. Engagement is up. Impressions are up. The follower count crossed a milestone, and someone made a little graphic about it. There is a section on “share of voice” with a number that nobody can quite explain. Page 14 has reach. Page 17 has email open rate. Page 21 has Domain Rating. The CFO is on the call. The CFO has questions.
The questions are always the same three. Did we make more money. What did each customer cost. Where should we put more budget. There is no slide for these. Nobody made a little graphic. The marketing director nods at “great question” and promises to follow up.
This article exists because we have watched that meeting too many times. Marketing teams that do excellent work, in good faith, with real expertise, present month after month using metrics that do not connect to any decision the business needs to make. The numbers are not wrong. They are just not the right numbers. And every quarter the CFO becomes a little less convinced that marketing is contributing to growth, until one day they suggest a budget cut, and the marketing team finds itself defending impressions against a redundancy plan.
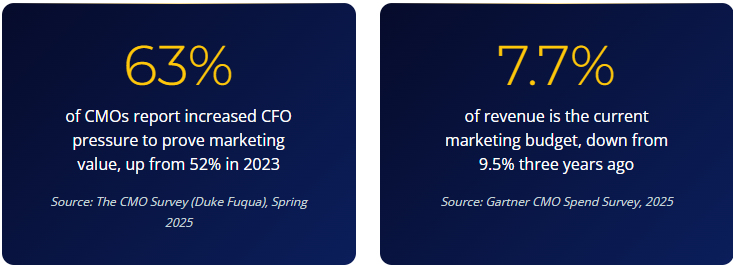
Marketing budgets fell from 9.5% of revenue in 2022 to 7.7% in 2025 (Gartner). 63% of CMOs report increased pressure from CFOs to prove marketing value, up from 52% in 2023 (CMO Survey, 2025). Board scrutiny is up 17 points in two years. The pressure is not theoretical any more. The cost of reporting the wrong numbers is now a job.
| What’s in the Monthly Marketing Report | What the CFO Asked For | What Happens Next |
|---|---|---|
| Impressions, reach, engagement rate | Did we make more money than last quarter? | The CFO concludes marketing is not measuring revenue |
| Email open rate (up 14% YoY) | What is a qualified lead actually costing us now? | The CFO notes marketing reports cannot answer cost questions |
| Domain Authority (up to 47) | Where should we put more budget? | The CFO discovers Google does not use DA, and trust quietly drops |
| “Influenced revenue” (rounded up generously) | What did marketing actually source? | The CFO senses the number is doing several jobs at once |
| “AVE” or “media value equivalent” from PR | What was the return on the PR retainer? | The CFO Googles AVE and discovers it has been industry-discredited since 2010 |
The Pressure That Just Got Real
Before we mock anyone for reporting vanity metrics (and we will, lovingly), the context. Marketing is operating in the hardest measurement environment since the 1990s. Tracking is degraded. Cookies are gone. Attribution windows are wrong. Privacy regulation kept tightening. Apple, Google and the rest of the platform layer have made it harder to measure marketing than at any point since spreadsheets were invented. None of this is the marketing team’s fault.
But the consequence is unambiguous. 64% of CMOs say “demonstrating the impact of marketing actions on financial outcomes” is their number-one challenge (CMO Survey, 2025). 77% report pressure to prove short-term ROI even when their strategy demands long-term thinking (The Drum, 2026). 59% of CMOs say their budget is insufficient to execute their strategy (Gartner, 2025).
The point of the article is not that you have been measuring badly. The point is that the things that used to be tolerated as “good enough” are not tolerated any more. The room has changed. The metrics have not.
The Engagement Rate That Went Up While the Audience Disappeared
This is the single best piece of evidence for the entire argument, and it comes from LinkedIn.
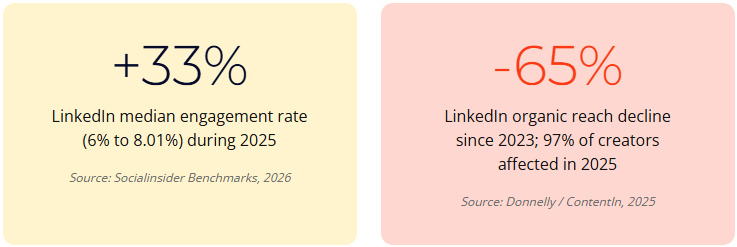
During 2025, LinkedIn’s median engagement rate rose from 6% to 8.01% (Socialinsider Benchmarks 2026). The cheerful interpretation: content quality improved, audiences engaged more, the platform rewarded depth. The marketing slide-deck interpretation: engagement is up 33% year on year. The little graphic was made. The arrow was green.
The actual context: across the same period, organic reach on LinkedIn fell 65% from peak (Donnelly Q3 2025 LinkedIn Update). 97% of LinkedIn creators reported a reach collapse in 2025 (ContentIn). Company page organic posts now reach 1.6% of followers, down from approximately 7% in 2021 (WrittenlyHub LinkedIn Algorithm Report 2025). Engagement rate went up because the denominator (impressions) went down faster than the numerator (interactions).
Read those two numbers next to each other for a moment. The engagement rate went up while almost everybody lost the majority of their audience. This is the platonic ideal of a vanity metric. It looks great. It says nothing about whether anybody saw your content, whether the right people engaged, or whether any of it produced revenue. A higher engagement rate on a vanishing audience is the marketing equivalent of being told you have a higher proportion of nice neighbours after a flood.
The Email Open Rate (Mostly Apple's Bots Now)
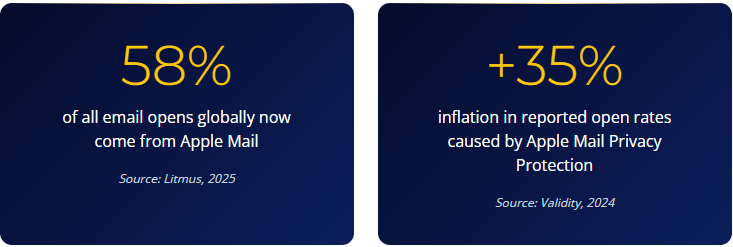
If you are still using email open rate as a measure of success in 2026, you are tracking Apple’s pre-fetch bots. Apple Mail Privacy Protection has been live since September 2021. Apple Mail accounts for roughly 58% of all email opens globally (Litmus, 2025). Approximately 64% of subscribers now read via an MPP-capable Apple Mail version. MPP fires an open whether the email was opened or not. It pre-fetches images so that Apple’s servers, not the user, register the open.
The Validity 2024 study found that Apple Mail Privacy Protection inflates reported open rates by up to 35%. Senders with Apple-dominant audiences see reported open rates running 18 to 32 percentage points above verified engagement. The number you are reporting is roughly half nonsense. The half that is real has no consistent relationship to whether the email did its job.
The serious email teams moved on years ago. Click-through rate, reply rate, revenue per send and conversion to action are the metrics that survive Apple. The teams that did not move on are still putting “open rate up 14%” in a board pack, while a quarter of those opens were Apple’s data centre acknowledging receipt on the recipient’s behalf.
Domain Authority and Other Numbers Google Has Never Heard Of
Domain Authority is a Moz score. Domain Rating is an Ahrefs score. They are useful as comparative indicators of how well a site competes for backlinks against others in its category. They are not Google ranking signals. Google has been explicit about this. John Mueller, repeatedly: “Google doesn’t use Domain Authority at all when it comes to Search crawling, indexing, or ranking.”
Yet DA / DR sits in marketing dashboards across the industry. Reported every month. Treated as if “DA up to 47” means the same thing as “more revenue from organic”. It does not. A site can have its DA increase steadily for two years while traffic, leads and pipeline fall. The relationship between third-party authority scores and commercial outcomes is weak, indirect, and frequently inverted. Reporting DR or DA as a success metric is, charitably, a habit. Less charitably, it is reporting a number a third-party tool invented because the third-party tool wanted to make their product look measurable.
The same logic applies to “share of voice” (without naming the methodology), “brand mentions” (without context for sentiment or audience), “press hits” (without attribution to action) and the truly venerable “AVE”, which we will deal with next.
AVE: The Industry's Most Embarrassing Open Secret
Advertising Value Equivalent (AVE) calculates the notional cost of buying the column inches a PR placement earned. A page in the Guardian’s print edition might be worth £20,000 of advertising space, so the PR placement is reported as “£20,000 of AVE”. It is then sometimes multiplied by 3 (or 5, or 10, depending on how confident the agency is feeling) to account for the editorial credibility multiplier. The number is presented to the client.
The Barcelona Principles, adopted globally in 2010 and refreshed through versions 4.0, are unambiguous: “AVEs are not the value of communication” (AMEC, Principle 5). The international PR industry has officially rejected AVE as a valid metric for sixteen years. It is still in PR reports. It is still in client decks. Some agencies have rebranded it to “media value”, “media impressions value” or “earned media value” to give the appearance of having moved on, while continuing to multiply rate-card prices by editorial weighting factors of their own invention.
The international PR industry officially rejected AVE in 2010. Sixteen years later, AVE is still in PR client decks. Sometimes under the name AVE. More often under a rebranded name that does the same calculation. This is roughly as if accountants were still reporting profits in shillings.
If your monthly PR report contains a “value” figure derived from column-inch cost multiplied by an editorial credibility factor, you are looking at AVE in a Halloween costume. Ask your agency to translate the report into reach (to defined target audiences), share of voice (with methodology), message penetration, and downstream attribution. Some will. Some will quietly invoice for “report restructuring”. The latter response is itself diagnostic.
The "Would the CFO Care?" Framework
The actionable output of this article. The framework is structured around the five questions a CFO actually asks about marketing spend. Every metric in your dashboard should map to one of these questions, or be moved out of the executive report into the operational one.
The five CFO questions
| CFO Question | Vanity Metric (cannot answer) | Value Metric (can answer) |
|---|---|---|
| 1. Did we make more money? | Impressions, reach, followers, engagement rate | Marketing-sourced revenue, marketing-influenced pipeline |
| 2. What did each customer cost? | CPM, CPC, engagement cost, “cost per impression” | CAC, blended CAC, CAC payback period, cost per qualified lead |
| 3. Will they stay? | Email open rate, page views, time on site | Retention rate, NRR, LTV, repeat purchase rate |
| 4. Is the pipeline real? | MQL volume, downloads, “intent signals”, form fills | Qualified pipeline, SQL conversion, win rate, pipeline velocity |
| 5. Where do we spend more? | Domain Authority, “share of voice”, AVE, social shares | LTV:CAC by channel, contribution margin by source, payback period by campaign |
The Vanity-to-Value translation
Every vanity metric in your current report has a value metric translation. Replace the metric, replace the slide.
- Impressions → Reach-to-intent ratio. Of the people who saw the content, how many took a downstream action.
- Followers → Engaged audience overlap with target persona. Followers who are not buyers are decoration.
- Engagement rate → Engagement-attributed pipeline. Did the engagement produce a commercial action.
- Email open rate → Click-to-conversion rate or revenue per send. Apple has eaten the open rate.
- Page views → Page conversion rate or assisted conversion value. A page that gets 50,000 views and converts at 0.1% is worse than a page that gets 500 views and converts at 12%.
- Domain Authority → Organic-sourced revenue. The output of authority is traffic that converts. Measure that.
- “AVE” / “media value” → Reach to target audience + sentiment + downstream attribution. The thing AVE pretends to be, calculated honestly.
- “Social mentions” → Branded search volume and direct traffic lift. The downstream evidence that the conversation moved someone.
- MQL volume → MQL-to-SQL conversion rate by source. Industry average is 13% (Data-Mania, 2026). High volume at 1% conversion is a worse problem, not a better one.
The CFO scoring system
Run every metric currently in your monthly report through three questions. Score one point per yes.
- Connection: Does this number connect, directly or through a documented chain, to revenue, retention, cost or risk?
- Action up: If the number doubled tomorrow, would we recommend doing more of whatever drove it?
- Action down: If the number halved, would we recommend stopping or rebalancing the activity?
3/3 is a board-pack metric. 2/3 is operational and stays in the team dashboard. 1/3 or 0/3 is a vanity metric and gets removed from executive reporting altogether. This is not complicated. Most marketing reports survive this audit losing 60-70% of their slides. The remaining 30% answers the CFO’s questions, which is the entire job.
For more on translating measurement into business outcomes, see our work on measurement, CRO and analytics services, and our digital marketing audit for the team-level diagnostic.
A higher engagement rate on a vanishing audience is the marketing equivalent of being told you have a higher proportion of nice neighbours after a flood.
When Vanity Metrics Are Actually Useful (the honest counterpoint)
Three concessions, because the argument is not that soft metrics are worthless. The argument is that they are misused.
First, brand awareness genuinely matters as a leading indicator. Ehrenberg-Bass research on mental availability has demonstrated, repeatedly, that being remembered at the moment of purchase drives most of the differential between brand performance and stagnation. Share of search has been shown to predict near-term market share movements. Branded query volume, when tracked over time with a methodology, is a legitimate executive metric. The mistake is treating “we got 4 million impressions” as if it equals brand awareness. It does not. Brand awareness is measured. Impressions are spent.
Second, operational metrics and reporting metrics are different jobs. Bounce rate is useful for the team trying to diagnose a poorly performing landing page. It is not useful for the CFO trying to decide if marketing should get another £200,000. The frame is not “delete all soft metrics”. It is “separate operational reporting from executive reporting, and stop putting one in the slot meant for the other”.
Third, audience-specific exceptions exist. A 5,000-follower niche community of senior procurement directors at FTSE 250 manufacturers is more valuable than 500,000 followers who like fitness content. Follower count without context is vanity. Follower count with audience composition can be a leading indicator. The variable that makes the difference is whether you can demonstrate the audience overlaps with the buying population.
Sector Translations (Because Vanity Metrics Are Universal)
Charities and non-profits
Common vanity metrics: campaign reach, social engagement, email open rate, page views on the donate page, “awareness”.
Translate to: donor acquisition cost, average gift value, donor retention rate, lifetime value of a donor, ratio of retention spend to acquisition spend. Bloomerang’s 2025 research found nonprofits spend approximately £0.20 to retain an existing donor against £1.50 to acquire a new one, a 7.5x cost differential. 70% of new donors only give once (CCS Philanthropy Pulse, 2025). The metric that matters is not how many donors clicked your campaign. It is how many came back.
B2B
Common vanity metrics: MQLs, content downloads, webinar registrations, social engagement, “intent signals”.
Translate to: marketing-sourced pipeline, SQL conversion rate by source, win rate, sales cycle length, CAC payback. 90% of B2B teams still rely on single-touch or basic multi-touch attribution; only 7.6% use AI-powered attribution to tie events to pipeline (RevSure, 2025). The average B2B deal takes 8-15 touchpoints to close (HockeyStack, 2025). Last-touch attribution undercounts top-of-funnel marketing by 2-3x. If your B2B board pack is reporting MQLs without conversion rates, the number is showing only the production line, not the warehouse output.
Ecommerce and DTC
Common vanity metrics: traffic, social impressions, email open rate, “engagement”, abandoned cart count.
Translate to: conversion rate, AOV, CAC by channel, CAC payback period, repeat purchase rate, contribution margin per order. Average ecommerce conversion sits between 1.9 and 3% globally; median AOV is $84; average cart abandonment is 70.22% (Triple Whale, 2025). Ecommerce CAC has risen 15-20% year on year across most sectors (Polar Analytics, 2026). If your ecommerce report shows “traffic up 40%, revenue up 4%”, the report is hiding the conversion-rate collapse, not surfacing it.
SaaS
Common vanity metrics: signups, MQLs, content engagement, demo bookings, “product-qualified leads”.
Translate to: trial-to-paid conversion, MRR / ARR contribution by source, churn rate, net revenue retention, CAC payback period, LTV:CAC ratio. Median SaaS LTV:CAC is 3.2:1 (Optifai, 939-company benchmark). 3:1 is the minimum healthy floor. Anything below that is a unit-economics problem dressed up as a marketing report.
What to Stop Reporting Tomorrow
If you take one action from this article, take this one. Remove the following from any executive-facing report this quarter. Keep them in operational dashboards where they belong. None of them are wrong as numbers. They are wrong as headlines.
- Impressions (any platform)
- Reach (without composition detail)
- Engagement rate (without revenue attribution)
- Follower count (without audience overlap with buyers)
- Email open rate (the Apple bot is reporting on your behalf)
- Domain Authority / Domain Rating
- Page views / sessions (without conversion rates)
- Time on page / average session duration (without commercial outcome)
- AVE / media value / “earned media value” of any flavour
- “Influenced revenue” (without distinguishing it from sourced revenue and disclosing methodology)
- “Share of voice” (without naming the universe and methodology)
- Social shares as a standalone metric
Replace each one with the value metric translation from earlier. The exercise is not glamorous. It involves a meeting with finance, a conversation with the agency, and possibly the rebuilding of three dashboards. Marketers who can calculate ROI are 1.6x more likely to get higher budgets (MarketingProfs, 2025). The mathematics of doing this work and the mathematics of not doing it both point at the same answer.
Browse the Fuel Room for our broader work on measurement, GEO and demand. Consider booking a strategy consultancy session if you want help with the translation in your specific sector.
Your 10-Step Vanity-to-Value Audit
- Pull your last monthly executive report. Print it. Highlight every metric. You should not need a highlighter for any board-pack metric the CFO genuinely uses to allocate capital.
- Score every metric against the three CFO questions. Does it connect to revenue, retention, cost or risk? Would doubling it justify doing more? Would halving it justify stopping? One point per yes. 3/3 stays. Anything else moves.
- Move 1/3 and 2/3 metrics into operational dashboards. They are not wrong. They are not executive. The team uses them to diagnose. The CFO does not need to see them.
- Replace impressions and reach with reach-to-intent ratios. Add the downstream commercial action to every reach figure. If you cannot, the reach data does not deserve a slide.
- Retire email open rate as a success metric. Replace with click-through, reply rate, conversion to action, and revenue per send. 58% of email opens are Apple Mail Privacy Protection bot pings. The number is not real.
- Remove Domain Authority / Domain Rating from executive reporting. They are third-party scores, not Google signals. Replace with organic-sourced revenue and qualified organic traffic.
- Audit your PR report for AVE in disguise. “Media value”, “earned media value”, “advertising equivalent” with editorial multipliers are all AVE. The international PR industry rejected AVE in 2010. Ask your agency to provide reach to defined audiences, share of voice with methodology, and downstream attribution instead.
- Audit your attribution methodology. Last-touch attribution undercounts top-of-funnel marketing by 2-3x on B2B deals that take 8-15 touchpoints. If your team is on single-touch, your investment case is half-built.
- Distinguish marketing-sourced from marketing-influenced revenue. “Influenced” is broader, softer, and frequently invoked when sourced revenue is uncomfortable. Report both. Disclose methodology. Treat the CFO as someone who can read.
- Brief the team and the agency. The new metric set has to be agreed across the team, the agency and the data layer. Without that alignment, the old vanity metrics regrow within two quarters. The work needs guarding.
Frequently Asked Questions
What is a vanity metric, exactly?
A vanity metric is a number that goes up and feels good but does not connect to a business decision. Impressions, followers, reach, engagement rate, email open rate, Domain Authority, social shares and AVE are the most common examples. The defining test: if the number doubled tomorrow, would anything change in the business? If the answer is no, it is a vanity metric. They are not always useless. They are useless when treated as outcomes rather than diagnostics.
Is engagement rate a vanity metric?
On its own, yes. The clearest evidence: LinkedIn median engagement rate rose from 6% to 8.01% during 2025 while organic reach fell 65% across the same period. A higher engagement rate on a vanishing audience does not produce more revenue. It produces a better-looking dashboard. Engagement rate is useful as a diagnostic for content quality. It is misleading as a top-line success metric. The number you actually want is engagement from the right audience, attributed through to a commercial outcome.
Should we stop reporting impressions altogether?
Not from your internal dashboard. From your board pack, yes. Impressions are a useful operational metric for diagnosing reach problems. They are a misleading executive metric because they do not distinguish reaching the right person from reaching the wrong person 100 times. The fix is to separate operational reporting (what the team uses to do its job) from executive reporting (what the CFO uses to allocate capital). Impressions belong in the first. They do not belong in the second.
What metrics should appear in a board pack?
Five things. Marketing-sourced revenue or marketing-influenced pipeline (with attribution methodology disclosed). Customer acquisition cost and CAC payback period. Lifetime value to CAC ratio, broken down by channel where the data supports it. Pipeline velocity or sales cycle length. Retention or net revenue retention. These five answer the questions a CFO actually asks: did we make more money, what did each customer cost, will they stay, is the pipeline real, and where should we spend more. Everything else is operational detail.
How do we know if a metric passes the 'CFO test'?
Run it through three questions. First: does this number connect, directly or through a documented chain, to revenue, retention, cost or risk? Second: if the number doubled, would we recommend doing more of whatever drove it? Third: if the number halved, would we recommend stopping or rebalancing? A metric that cannot answer all three is a number that goes up. A metric that answers all three is information the CFO can act on. The full Vanity-to-Value framework gives a 10-point scoring system that operationalises this test.
More clicks, same pipeline? We can diagnose that.
Free measurement audit. We will show you which of your dashboards are reporting numbers, and which are reporting decisions.
Sources
The CMO Survey, Spring 2025 (Duke Fuqua) – 63% of CMOs report increased CFO pressure (up from 52%); 50% report board pressure; 64% cite “demonstrating financial impact” as #1 challenge
Gartner CMO Spend Survey, 2025 – Marketing budgets at 7.7% of revenue (down from 9.5% three years earlier); 59% of CMOs say their budget is insufficient
The Drum, 2026 – 77% of CMOs face short-term ROI pressure even when strategy demands long-term thinking
Litmus / Email Tool Tester, 2025 – Apple Mail accounts for ~58% of all email opens globally; ~64% of subscribers use MPP-capable Apple Mail
Validity / Paubox, 2024 – Apple Mail Privacy Protection inflates reported open rates by up to 35%
Socialinsider LinkedIn Benchmarks 2026 – Median LinkedIn engagement rate rose from 6% to 8.01% during 2025
WrittenlyHub LinkedIn Algorithm Insights Report 2025 – Company page organic posts reach only 1.6% of followers (down from ~7% in 2021); 97% of creators saw reach collapse in 2025
Search Engine Journal / John Mueller – “Google doesn’t use Domain Authority at all when it comes to Search crawling, indexing, or ranking”
AMEC Barcelona Principles – “AVEs are not the value of communication” (adopted globally 2010, updated to 4.0)
RevSure State of B2B Marketing Attribution, 2025 – Nearly 90% of B2B teams use single-touch or basic multi-touch attribution; only 7.6% use AI-powered attribution
HockeyStack B2B Attribution Playbook, 2025 – Average B2B deal: 8-15 touchpoints; last-touch undercounts top-of-funnel by 2-3x
Optifai B2B SaaS LTV:CAC Benchmarks – Median LTV:CAC ratio across SaaS segments is 3.2:1 (939-company benchmark)
MarketingProfs, 2025 – Marketers who can calculate ROI are 1.6x more likely to receive higher budgets
Triple Whale Ecommerce Benchmarks, 2025 – Average ecommerce conversion 1.9-3%; median AOV $84; average cart abandonment 70.22%
Bloomerang Donor Retention Research, 2025 – ~$0.20 to retain an existing donor vs ~$1.50 to acquire a new one (7.5x cost differential)
Data-Mania MQL to SQL Benchmarks, 2026 – Industry-average MQL to SQL conversion rate is 13%